1. Introduction
A coating material sample was submitted for laboratory analysis. A total quantity of 300 g of material was provided. The purpose of this study was to evaluate the curing behaviour and thermal stability of the coating using Infrared (IR) Spectroscopy and Thermogravimetric Analysis (TGA).
2. Sample Preparation
The coating material was applied to a glass panel with a wet film thickness (WFT) of 50 µm. Two curing conditions were evaluated:
- Sample 1: Dried at 180 °C for 30 minutes
- Label: X1
- Dry film thickness (DFT): 10 µm
- Sample 2: Dried at 180 °C for 60 minutes
- Label: X2
- Dry film thickness (DFT): 10 µm
After curing, free films were prepared for further analysis.
3. Infrared (IR) Spectroscopy Analysis
The IR spectrum of samples was measured in the range of 4000-400 cm-1 (see Figure 1 and Figure 2) using a Nicolet iS50 instrument, using ATR technique on a diamond crystal (ATRC) and, for sample, also on a ATRSi.
3.1 Results
- Isocyanate Group:
The presence of isocyanates (at 2261 cm-1) was detected in the IR spectrum of sample X1, which is why the sample was dried for another 30 minutes. After drying the sample for 60 minutes, this band was no longer detected in the spectrum (see Figure 2).
- Carbonyl Groups (C=O):
Strong absorption bands were observed at 1720–1730 cm⁻¹ and 1680–1690 cm⁻¹, confirming the presence of carbonyl-containing components.
- Epoxy Groups:
The characteristic band of the epoxy group (at 900-910 cm⁻¹) was difficult to detect. Compare the integrated area of the infrared absorption peaks of C=O and epoxy group:
The integrated peak areas of the C=O and epoxy groups were compared, indicating a low relative contribution of epoxy groups after curing.
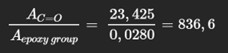
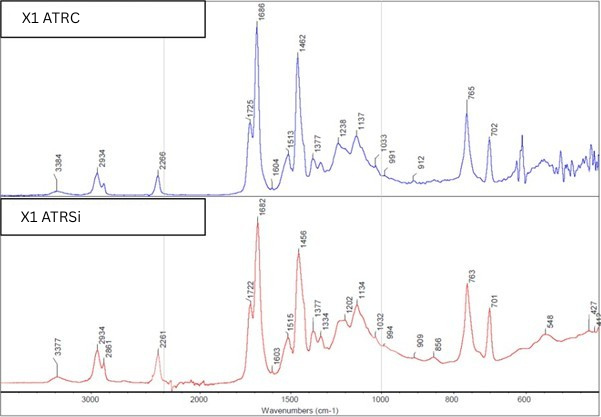
Figure 1: IR spectrum of the sample on crystal ATRC and ATRSi.
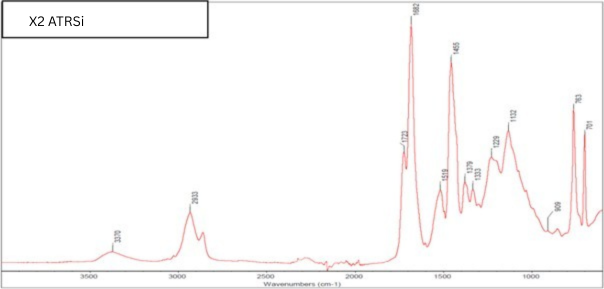
Figure 2: IR spectrum of the sample on crystal ATRSi.
4. Thermogravimetric Analysis (TGA)
Sample was analyzed using thermogravimetric analysis in an air atmosphere.
- Sample mass: 20 mg
- Temperature range: Room temperature to 1000 °C
4.1 Results
The measured thermogravimetric record is shown in Figure 3.
- 300–450 °C: Major thermal decomposition occurred in this range, leaving a residue of 24.8% at 450 °C.
- 450–700 °C: Further decomposition was observed, with the residue decreasing to 9% at 700 °C.
- 700–1000 °C: No additional weight loss was detected, indicating thermal stability of the remaining
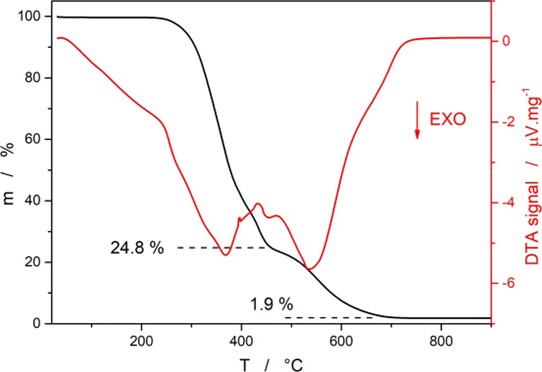
Figure 3. Thermogravimetric recording of sample.
5. Conclusions
- Complete curing of the coating requires at least 60 minutes at 180 °C, as confirmed by the disappearance of isocyanate groups in the IR
- The material contains prominent carbonyl functional groups, while epoxy groups are present in low or weakly detectable amounts after
- The coating exhibits thermal stability up to approximately 300 °C, followed by significant decomposition between 300 and 700 °C.
- Only a minimal inorganic or thermally stable residue remains above 700 °C.